5/25/2026
Data AnalyticsPower BI vs Tableau: Which Analytics Platform Wins in 2026?
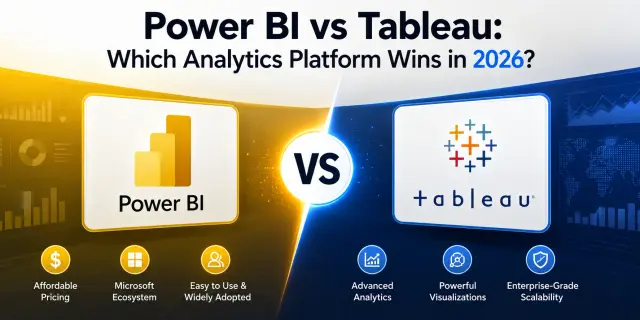
Table of contents
Table of Contents
- Power BI vs Tableau 2026: Quick Overview
- What Is Power BI and Tableau?
- Power BI vs Tableau 2026: Feature-by-Feature Comparison
- Tableau vs Power BI Salary and Career Opportunities
- Should You Learn Power BI or Tableau in 2026?
- Frequently Asked Questions
- Final Thoughts
Power BI vs Tableau 2026: Quick Overview
If you are comparing Power BI vs Tableau 2026 then this answer is for you: Well, both comes with their own advantage. Power BI is more common choice among students and beginners in India. While Tableau is more specialised for advanced visualization, consulting firms, or high-end BI roles.
What Is Power BI and Tableau?
Power BI
Microsoft Power BI is Microsoft’s BI tool helps users connect data, create visual dashboards, share insights across teams and automate reports.
The biggest advantage? It fits naturally with tools Indian businesses already use every day — Excel, Teams, Azure, and SQL Server. Because of these advantages, banks, startup and many e-commerce platforms prefer Power BI.
According to Microsoft, over 350,000 organizations globally use Power BI for analytics and reporting.
Tableau
Tableau is widely known for its delivering data visualization and dashboard storytelling.
Many consulting firms, multinational companies, and analytics-heavy organizations still prefer Tableau for executive reporting. Once Tableau became part of Salesforce, the platform evolved with tighter connectivity to cloud analytics and CRM technologies.
Tableau and Power BI have consistently been recognized by Gartner’s Magic Quadrant as top-performing analytics platforms globally.
Power BI vs Tableau 2026: Feature-by-Feature Comparison
Here’s where things get practical.
Comparison Table: Power BI vs Tableau 2026
Feature
Tableau
Best For
Beginners, SMEs, job seekers
Advanced analysts, enterprises
Ease of Learning
Easier
Moderate
Pricing
Affordable
Expensive
Visualization Quality
Very good
Excellent
AI Features
Strong Microsoft Copilot integration
Strong AI analytics tools
Excel Integration
Excellent
Limited
Data Handling
Strong
Excellent for massive datasets
Community Support
Huge
Strong
Demand in India
Very high
High
Mobile Dashboards
Good
Excellent
Certification Cost
Lower
Higher
Dashboard Design and Visualization
For visual storytelling Tableau still holds a strong edge, in a way it just looks more polished most of the time. If you’ve ever seen a beautifully animated dashboard with smooth interactions and refined visuals, there’s a good chance it was built in Tableau.
Whereas Power BI dashboards have improved massively since 2024, though. Microsoft’s AI visuals and Copilot features now help beginners build dashboards much faster.
For most businesses across India, Power BI delivers basically all the capability they usually need, no extra fuss.
Data Handling and Performance
Tableau handles very large datasets smoothly. That’s useful for enterprise analytics teams working with millions of rows.
Power BI performs well too, especially with proper data modeling. But beginners sometimes struggle with DAX optimization.
This is where hands-on training matters more than theory. We've noticed students who practice real dashboards weekly become job-ready much faster than those only watching tutorials. data analytics course with placement
AI and Automation Features
AI is changing analytics rapidly.
Microsoft integrated Copilot deeply into Power BI, allowing users to generate reports using natural language prompts. That’s a huge advantage for beginners.
Imagine typing:
“Show monthly sales trends by region.”
Power BI can now generate visuals automatically. Tableau also offers AI-driven insights, but Microsoft’s AI ecosystem currently feels more accessible and beginner-friendly.
Why Power BI for Beginners India Makes Sense
For most beginners and fresh graduates, Power BI feels a lot easier to pick up, because the interface kinda seems familiar, especially for folks who already have basic Excel knowledge. That familiarity makes the whole learning curve smoother, cuts down on confusion, and lets learners build dashboards, then analyze data, with a lot more confidence. business analytics course
Power BI also has:
- Lower setup costs
- Simpler drag-and-drop workflows
- Better Hindi and Indian YouTube learning resources
- Strong placement demand in India
That’s why “Power BI for beginners India” has become one of the fastest-growing analytics search trends recently.
Tableau Has a Steeper Learning Curve
Tableau is also not exactly hard to learn, but new users usually need a bit more time before they feel comfortable with things like calculations, parameters, and those more advanced visual interactions. A lot of learners report that Tableau makes more sense once they’ve built a basic foundation in analytics, and data visualization.
We’ve seen working professionals enjoy Tableau more after gaining basic analytics experience first.
A common path looks like this:
- Learn Excel
- Learn SQL
- Learn Power BI
- Add Tableau later
That sequence usually works better than jumping directly into Tableau.
Tableau vs Power BI Salary and Career Opportunities
Which Tool Has More Jobs in India?
Right now, Power BI dominates entry-level hiring in India.
Search job portals and you’ll notice:
- More Power BI analyst openings
- More reporting roles
- More MIS and BI support jobs
- More startup demand
Tableau roles exist too, but many require prior analytics experience.
Tableau vs Power BI Salary
Here’s the reality most blogs avoid saying clearly.
Your salary depends more on:
- SQL skills
- Problem-solving ability
- Portfolio quality
- Domain knowledge
The tool alone won’t double your salary. Still, Tableau professionals often earn slightly higher salaries in consulting and enterprise analytics roles.
Average Salary Trends in India (2026 Estimates)
Role
Power BI Salary
Tableau Salary
Fresher Analyst
₹4–6 LPA
₹5–7 LPA
Mid-Level BI Analyst
₹8–14 LPA
₹10–16 LPA
Senior Analytics Consultant
₹18–30 LPA
₹20–35 LPA
Source references: Glassdoor, AmbitionBox, LinkedIn Jobs trends.
What Recruiters Actually Look For
Recruiters rarely hire someone just because they “know Tableau.”
They hire people who can:
- Explain business insights clearly
- Build dashboards fast
- Handle messy data
- Present findings confidently
That’s why project-based training matters far more than certificate collecting.
Should You Learn Power BI or Tableau in 2026?
Choose Power BI If You:
- Are a beginner
- Want faster job opportunities
- Already use Excel
- Want affordable learning
- Plan to work in Indian startups or SMEs
- Need placement-oriented analytics skills
Choose Tableau If You:
- Already know analytics basics
- Love advanced dashboard storytelling
- Want consulting or enterprise BI roles
- Work with large-scale datasets
- Plan to work internationally
The Smartest Career Strategy?
Choosing between Power BI and Tableau is not a final decision. Many professionals start with Power BI to build strong analytics fundamentals, then learn Tableau to enhance visualization and storytelling skills. Knowing both tools improves career opportunities since different companies use different BI platforms. Tableau analytics platform
Important Points
- Start with Power BI to build analytics fundamentals
- Learn Tableau later to strengthen advanced visualization and storytelling skills.
- Having knowledge in both tools makes you more versatile.
- Many senior analysts and consultants use both Power BI and Tableau according to client or project needs.
Frequently Asked Questions
Which is better in 2026: Power BI or Tableau?
Both come with their advantages according to your requirements. Like Power BI is more suitable for beginners and Tableau is best for users looking for advanced visualization and analytics roles.
Is Tableau harder than Power BI?
Yes, Tableau generally has a steeper learning curve for beginners. Power BI feels more familiar to users with Excel experience, while Tableau requires stronger understanding of data visualization logic and calculations.
Can I get a job by learning only Power BI?
Ofcourse, you can. For the entry-level roles in analytics and MIS Power BI is enough. But, if you gain more practical knowledge by working on real projects and improving communication skills, you can grab more placement opportunities.
Which tool pays more: Tableau or Power BI?
Tableau users sometimes see a bit higher compensation in consulting and enterprise analytics spaces. Still, salary growth is more tied to how you handle problem solving, domain know-how, and project experience than it is about the tool, just the tool.
Should I learn Tableau after Power BI?
That’s usually the smartest approach. Learning Power BI first builds strong analytics fundamentals. Once you understand reporting, dashboards, and data modeling, Tableau becomes easier to master.
Is Power BI enough for data analytics careers in India?
For many beginner and mid-level analytics roles, yes. Power BI is heavily used across Indian startups, IT companies, ecommerce brands, and consulting firms. Still, adding SQL, Excel, and basic Python skills creates stronger career opportunities.
Which industries use Tableau the most?
Tableau is commonly used in consulting, finance, healthcare analytics, enterprise SaaS companies, and multinational corporations that prioritize advanced dashboard storytelling and large-scale reporting.
Do companies use both Tableau and Power BI?
Absolutely. Many companies end up using several business intelligence tools depending on department needs, client constraints and the existing software setup. Senior analysts often switch between both platforms comfortably.
Final Thoughts
The argument about Power BI vs Tableau 2026 isn’t really about which platform is always “better” . Kinda, it’s about which one fits your present career stage, or whatever you’re doing right now. For beginners, microsoft Power BI usually offers the fastest route into analytics jobs in India. Tableau starts looking incredibly useful once you move toward advanced analytics, consulting work, or enterprise reporting. The real differentiator isn’t the software—it’s your ability to solve business problems with data.
Well, If you’re looking to build these skills in a structured and beginner-friendly way, NIDADS offers programs designed to help you learn Power BI and Tableau effortlessly, even if you’re starting from scratch. Their course curriculum majorly focuses on practical learning approach and saves lots of your time in searching which skills to learn or not. We also provide real-world datasets and tools for better learning and confident work.
About the Author
Quick facts
Name: Deepanshu
From: Delhi
Education: MCA
Program: Data Science and Data Analytics
Placed in: NIDADS (National Institute of Data Analytics & Data Science)
Covers topics: Data Science, Data Analytics, Artificial Intelligence, Machine Learning, Data Engineering, Deep Learning
Currently working as: Senior Data Analyst
In his words: "Data doesn't just tell you what happened — it tells you what to build next. My job is to turn numbers into decisions that actually move the needle."