8/17/2026
Data AnalyticsData Analyst Roadmap: Build Skills That Open Careers
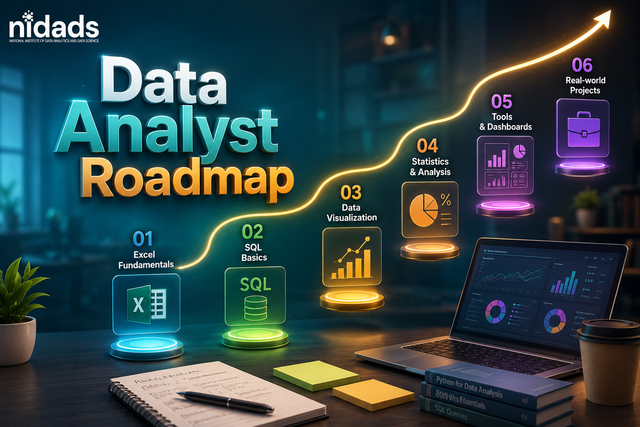
Table of contents
Data Analyst Roadmap for Beginners: Master the Skills, Projects and Business Thinking That Turn Beginners into Job-Ready Analysts
A data analyst roadmap for beginners is a fixed learning sequence: Excel, SQL, statistics, Python, then visualization tools, all backed by real projects. It's built around what employers actually screen for first. SQL shows up in roughly 53% of postings, more than Excel (50.5%) and well ahead of Python (31.2%). That gap is the whole reason SQL comes before Python here.
Introduction
Most beginners pick skills at random. Python and machine learning get the attention because they sound advanced, then reality hits in the first interview when the recruiter opens with a SQL question instead.A structured roadmap avoids that mismatch. The order below follows current job-posting data instead of generic advice.Ahead: the full learning sequence, a 180-day timeline, two comparison tables, the best tools for each stage, common mistakes, and nine FAQs.
Key Takeaways
•SQL shows up in 52.9% of postings, Excel in 50.5%, Python in 31.2% — the roadmap below just follows that order.
•Average US data analyst salary for 2026 sits near $111,000, roughly $20,000 higher than 2025.
•Indian freshers usually land ₹3.5–6 LPA. The national average was close to ₹6.87 LPA as of March 2026.
•Add Python and a BI tool to SQL, and freshers in India can reach ₹7–9 LPA.
•70% of analysts already use AI tools daily. Interpretation is still the skill employers say is missing.
•About a third of roles (34%) offer remote or hybrid work.
•A focused 4–6 month plan built around projects beats months of scattered certificates.
Why Learning Order Matters
Get the order wrong and you waste study time on skills nobody's testing yet. In most hiring pipelines, SQL acts as a pass/fail filter — it happens before a recruiter even opens your portfolio.
•Over half of 2026 postings ask for SQL directly. Weak SQL often ends the conversation before anything else gets a fair look.
•Excel hasn't gone anywhere — it's still active in 41–50% of listings, mostly because non-technical managers open it themselves.
•Python and the visualization tools come third. Companies only care once your data handling is dependable.
•Statistics is the one people skip, and it's also the one that explains why a number moved instead of just reporting that it did.
The Complete Roadmap: 7 Steps
This is the order employers actually test for, step by step, so nothing here is wasted effort on something that shows up late in the interview process.
1.Learn Excel first. Pivot tables, VLOOKUP/INDEX-MATCH, Power Query — covers most of what junior reporting roles ask for.
2.Then SQL. SELECT, JOIN, GROUP BY, window functions. Master this one above all — most take-home tests are built on it.
3.Statistics comes next. Descriptive stats, correlation vs. causation, a hypothesis test or two. This turns a report into an explanation.
4.Python after that. Pandas and NumPy for automating reports and larger datasets. For statistics-heavy roles, a dedicated R Programming Course may serve better.
5.Data cleaning and EDA. This eats 40% or more of a working week once you're actually on the job.
6.Visualization and dashboards. Power BI for Microsoft-heavy companies; Tableau shows up more in marketing and consulting.
7.Projects and a portfolio. Three to five real, end-to-end projects around actual business questions, before applying anywhere.
Worth flagging on data cleaning: most course datasets arrive spotless, and real data doesn't. Expect missing values, duplicate rows, dates in three different formats, and outliers to catch before trusting anything downstream.
180-Day Timeline
A rough calendar keeps you from bouncing between unrelated tutorials for six months with nothing to show for it.
•Days 1–30 — Excel basics plus SQL fundamentals (SELECT, WHERE, JOIN, GROUP BY).
•Days 31–60 — Statistics, then advanced SQL: window functions, subqueries.
•Days 61–90 — Python — Pandas, NumPy — alongside ongoing data-cleaning practice.
•Days 91–180 — Visualization, dashboards, portfolio projects, resume work, and interview prep.
Each block leans on the one before it. Jump ahead to Python or dashboards too early, and you'll likely end up circling back once an interviewer tests the SQL you skipped.
Skill Demand Comparison
The table below comes from verified 2026 job-posting analysis, and it's the actual reason the sequence above puts SQL and Excel ahead of Python.
| Skill | Job Posting Demand (2026) | Priority Order |
| SQL | 52.9% | Learn first |
| Excel | 50.5% | Learn first |
| Python | 31.2% | Learn third |
| Power BI | 24–29% | Learn fourth |
| Tableau | 26–28% | Learn fourth |
 Skill Stack vs Salary Outcome (India, Fresher Level)
Every extra tool in a fresher's stack tends to push salary up. Go from one tool to three, and the gap can more than double the starting number.
| Tool Stack | Typical Fresher Salary |
| Excel only | ₹3–4 LPA |
| Excel + SQL | ₹4–5 LPA |
| SQL + Power BI or Tableau | ₹5–7 LPA |
| SQL + Python + BI tool | ₹7–9 LPA |
For city-wise and experience-wise numbers, see the Data Analyst Salary in India 2026 guide.
Tools Worth Learning at Each Stage
The specific tool inside each category matters more than beginners assume — pick the wrong one and you'll relearn it later.
•Spreadsheets. Excel first. Google Sheets helps too, mainly because some startups run reporting off shared cloud files.
•Databases. Practice on PostgreSQL or MySQL, not a browser SQL simulator. Both are free, and both match real company stacks.
•Statistics. A short applied course beats a theoretical semester. You're reading a chart correctly, not deriving a formula.
•Python libraries. Pandas and NumPy cover the beginner stage. Add Matplotlib or Seaborn later for quick exploratory charts.
•Version control. Basic Git and GitHub turn a portfolio project into something a reviewer can actually browse.
Soft Skills That Support This Roadmap
Tools alone won't get you hired. Recruiters test for these alongside the technical stuff, often without saying so.
•Critical thinking — a surprising result is usually a broken join, not an insight.
•Business communication — can you explain a finding to someone who's never opened a SQL editor?
•Stakeholder management — clarify what a request actually means before writing a query.
•Attention to detail — a duplicated row can quietly double a revenue number.
Portfolio Projects That Get Noticed
•Sales dashboard — Power BI, a cleaned retail dataset, filters, and a written recommendation.
•Churn analysis — SQL plus Python to spot patterns, then propose one specific action.
•Campaign comparison — a basic hypothesis test instead of just claiming one campaign "performed better."
•Skip Titanic and Iris. Reviewers have seen both so often that using either signals a tutorial exercise, not independent work.
•Write a README for every project — the business question, method, and conclusion, in plain language.
A placement-oriented Data Analytics Course with Placement pairs this project list with mentor feedback and real deadlines.
Common Mistakes Beginners Make
8.Jumping into Python before SQL is solid — this runs directly against what hiring data actually shows.
9.Collecting certificates instead of finishing two or three documented projects.
10.Building a dashboard before figuring out what business question it's supposed to answer.
11.Not being able to explain a cleaning step or a chart choice when someone asks directly.
12.Only applying to "3+ years required" postings while ignoring the genuine entry-level roles.
How Recruiters Screen Candidates
There's usually a set order here, which makes it more predictable to prepare for than beginners expect.
•Portfolio or take-home case study, reviewed before any conversation happens.
•Live SQL testing, often shared-screen, to confirm the portfolio wasn't a fluke.
•Can you explain a finding in plain language to someone non-technical?
•Do you know the company's specific BI stack — Power BI, Tableau, Looker?
•Business judgment — does the candidate ask clarifying questions first?
For broader context, the U.S. Bureau of Labor Statistics tracks related analytics occupations, 365 Data Science runs an annual skill-demand report, and Google's Data Analytics Certificate remains a widely recognized entry point.
AI Tools and the Changing Analyst Role
AI copilots have shifted where an analyst's time goes, without removing the need for a trained person behind the tool.
•70% of analysts already use AI daily — drafting SQL, summarizing a dataset, generating a first-pass chart.
•An AI tool can write a query in seconds but can't judge whether that was even the right question.
•Recruiters point to interpretation, not query-writing speed, as the widest gap they see.
If anything, this raises the bar on statistics and judgment rather than lowering it on technical skill. Almost anyone can generate a chart now — very few can tell you whether to trust it.
Conclusion
The fastest route into data analytics still follows real hiring data: Excel, SQL, statistics, Python, and a portfolio built on genuine business questions rather than borrowed datasets. AI tools speed up the mechanical parts of the job, but that raises the value of interpretation and judgment — it doesn't replace them. Follow the order, skip the generic datasets, and be able to explain every decision. Do that, and interviews start turning into offers far more often than certificate-collecting ever managed.
Frequently Asked Questions
Is SQL more important than Python for beginners?
For entry-level interviews, yes. SQL turns up in 52.9% of postings against 31.2% for Python and gets tested more often too.
How long does this roadmap take to complete?
Most people reach interview-ready in 4–6 months. 45–60 minutes a day, plus weekend project work, beats occasional marathon sessions.
Do I need a degree to become a data analyst?
Not really. Employers care more about demonstrated skills and a documented portfolio than a specific degree for entry-level roles.
What salary can a fresher expect in India?
Around ₹3.5–6 LPA to start, climbing to ₹7–9 LPA once SQL, Python, and a BI tool are in place.
What salary can a fresher expect in the US?
The 2026 average sits near $111,000 across all experience levels — entry-level pay starts below that.
Are certifications necessary for this career?
They help pass automated resume filters, but two or three real projects are what actually convince a recruiter to call.
Which visualization tool should beginners learn first?
Power BI suits a Microsoft-heavy background. Tableau shows up more often in marketing and consulting roles.
Is data analytics still a good career choice?
Yes — demand holds up, 34% of roles offer remote or hybrid setups, and AI is increasing the need for interpretation, not shrinking it.
Should beginners learn Power BI or Tableau first?
Either works. Power BI leans toward Microsoft shops; Tableau turns up more in marketing and consulting listings.
About the Author
Quick facts
Name: Deepanshu
From: Delhi
Education: MCA
Program: Data Science and Data Analytics
Placed in: NIDADS (National Institute of Data Analytics & Data Science)
Covers topics: Data Science, Data Analytics, Artificial Intelligence, Machine Learning, Data Engineering, Deep Learning
Currently working as: Senior Data Analyst
In his words: "Data doesn't just tell you what happened — it tells you what to build next. My job is to turn numbers into decisions that actually move the needle."