10/23/2026
Data ScienceData Driven Decision Making: Process & Benefits
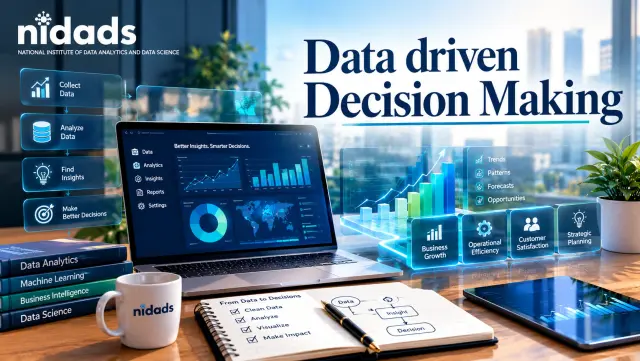
Table of contents
Data Driven Decision Making: Process, Benefits and Examples
Decision making which is based on data is the utilization of reliable data, statistical analysis and measurable proof which guide business and personal decision making. This process facilitates companies spotting trends, understanding their clients, measuring success, eliminating ambiguity and evaluating results. By joining analytical intelligence with professional experience companies are capable of making the right decision.
Key Takeaways
- Data driven decision making uses evidence of relying only on guesses.
- The process starts with setting goals then gathering data looking at what the data shows and checking how well the results match expectations.
- Data analytics and business intelligence turn. Facts into useful understanding.
- Having data protecting privacy and avoiding bias are key to getting trustworthy results.
- Any organization, no matter how big or small can use data-driven methods, with the tools and strong direction.
What Is Data Driven Decision Making?
The term “data driven decision making” refers to making decisions based on proven data and analysis, rather than relying exclusively on assumption. Companies are able to learn from the behavior of customers, business performance and results, market conditions, and any other performances in order to make the best possible decision based on facts.
Data analytics transforms the raw data into valuable insights while business intelligence illustrates its findings through reports and visualization tools. Statistical analysis may find correlations between data, however interpretation is also very important as correlation does not always mean causation. Great decisions are those where results are linked to a clearly formulated question.
Understanding how data analytics differs from data science and supports business decisions helps explain how raw information can be transformed into meaningful insights.
Why Data Driven Decision Making Is Important
Organizations are faced with various choices such as budgets, customer experience, employees, product development, and growth. The data helps to make the choices more transparent by showing the situation, where the results differ, and which assumptions need to be tested.
The significance of data driven decision making becomes much higher if decisions concern a big number of customers or involve huge expenditures. The information must be relevant, current, and representative. Using outdated information or incomplete data, one can reach erroneous conclusions.
Benefits of Data Driven Decision Making
Data driven decision making brings numerous advantages. Some of them are better defined long-term plans, uniform work habits, quicker identification of issues, and better allocation of resources. Decisions can be taken with the aid of data concerning which marketing campaigns are able to bring potential clients to the company, which products are the most popular for returning sales, and which operations are the slowest. Thus, decisions can also be reasoned from an objective perspective.
Based on data, companies can run experiments. For instance, a company can compare the two layouts of its web-page by measuring the conversion rates of each layout, adopting the more effective one. It has to be taken into account that increasing clicks may not necessarily mean higher levels of customer satisfaction or profit. Select metrics that are more important for making business decisions.
Data Driven Decision Making Process
Define the Problem and Objectives
When starting out, focus on the decision to be made, rather than having to rely on various measurements to back it up. For instance, one should not state “improve logistics” but rather “minimize late deliveries.” Establish one measurement and timeline before moving on to the next tasks.
Collect Relevant Data
Use credible sources to gather information like transaction records and survey results from customers, web site statistics, and internal operating systems. It is important to check whether definitions are consistent. If so, remove duplicates, solve missing values, and write down limitations. Data governance helps to understand who has access to the information, who owns it, how long it should be kept, and what to do with it.
Analyze and Interpret Data
Make use of descriptive analytics to find out what occurred and diagnostic analytics to determine the reason for your finding. Graphical tools help with the identification of trends and comparisons. Statistical analysis enables one to separate crucial pattern from random variation. Machine learning gets complicated relationships but requires model assessment and monitoring.
Identify Possible Solutions
Turn these findings into potential alternatives. Make an estimate of the benefits, costs, risks and required efforts for implementation. Predictive analytics provides information about possible outcomes, and prescriptive analytics involves comparison of possible options. Irrespective of its usefulness, it does not remove uncertainty.
Make Decisions and Measure Results
Assign responsibility, take action and monitor useful KPIs. Compare results with the baseline and target. In case the outcomes differ from expectations, investigate instead of hiding the gap with the help of recording lessons.
Data Driven Decision Making in Business
Data plays a part in decisions related to pricing, stock, personnel, marketing, and customer service. For example, a store may apply sales data, seasonality, and inventory levels to plan for future orders or to determine whether to do any promotional activities this week. The customer service department can study their average response times and satisfaction rates in order to check whether any training or adjustments in the workforce are necessary.
Business intelligence dashboards allow teams to track KPIs; however, using a dashboard and adopting an effective strategy toward decision making are two different things. The decision makers should share the same understanding of the meaning of metrics and ensure that employees are aware of the results of measuring them. A small company does not need to spend a fortune on some technological solutions and advanced software; it can simply use a computer spreadsheet with a few simple yet significant parameters.
Professionals who want to strengthen their analytical skills can follow a practical roadmap for building data analyst skills and learn how to interpret data for better business decisions.

Data Driven Decision Making Examples
Healthcare providers analyze missed appointments for enhancement of scheduling while maintaining patient privacy. Banking organisations analyze the transactions for fraud detection purposes. Retail businesses check their sales data for stock level management while online-sale organizations analyse abandoned purchases.
Market marketing departments analyze the expenses of advertising campaigns and number of leads acquired. Producers examine defective item rates for maintenance planning purposes, educational establishments verify the records of trip attendance for identification of the students needing assistance, and logistics companies deal with delivery time analysis for route improvement.
Tools Used for Data Driven Decision Making
Spreadsheets can be used to manage data for small analyses while SQL is used to collect data from databases. For making visual reports Power BI and Tableau can be used while Python is used for statistical analysis as well as for automating the tasks.
Challenges in Data Driven Decision Making
Problems with bad data quality along with absence of some data, inappropriate samples of data, or data that is outdated may all lead to wrong conclusions. There is also the problem of confirmation bias which causes decision-makers to overlook the factors which don’t support their views.
Some steps that should be taken to protect confidential information include checking automated recommendations and making sure that employees have learned how to deal with data properly.
How to Build a Data Driven Culture
A data driven culture helps teams use facts, challenge ideas and check results. Begin by finding a business problem, creating a goal, looking at important data, testing options and seeing what works.
Small businesses can start with spreadsheets and simple measures. Learning about the data analytics trends in 2026 can also help companies find ways to get better at using data.
Data Driven Decision Making vs Intuition Based Decision Making
Data driven decision making relies on measurable evidence, whereas intuition based decisions depend primarily on experience and instinct. Combining both approaches can improve judgment when data has limitations.
| Dimension | Data driven approach | Intuition based approach |
| Main input | Evidence and analysis | Experience and instinct |
| Strength | Measurable results | Quick decisions |
| Limitation | Depends on data quality | Can involve personal bias |
| Best use | Evidence-based planning | Situations with limited data |
Descriptive Analytics vs Predictive Analytics vs Prescriptive Analytics
| Type | Main question | Typical use |
| Descriptive analytics | What happened? | Reviewing sales |
| Predictive analytics | What may happen? | Forecasting demand |
| Prescriptive analytics | What should we do? | Comparing solutions |
For a deeper understanding of how businesses use reliable data to make informed decisions, explore IBM’s guide to using data to support better business decisions.
Organizations can also use NIST’s framework for identifying and prioritizing data analytics opportunities to identify where analytics can deliver the most value.
Frequently Asked Questions
1. What is data driven decision making?
It uses data and analysis to guide decisions instead of relying entirely on assumptions.
2. Why is it important?
It helps organizations evaluate performance and reduce uncertainty.
3. What is the process?
Define objectives, collect data, analyse findings, choose an action, and measure results.
4. What are its benefits?
Better planning, resource allocation, and performance measurement.
5. How is it used in business?
Businesses apply it to marketing, inventory, pricing, and customer service.
6. Which tools are commonly used?
Spreadsheets, SQL, Power BI, Tableau, and Python.
7. Can small businesses use it?
Yes. They can begin with sales records and simple performance metrics.
8. What are the main challenges?
Poor data quality, bias, privacy risks, and limited analytical skills.
9. How can results be measured?
Compare key performance indicators before and after an action.
10. Is data better than intuition?
Both are useful when evidence is combined with experience and context.
Conclusion
Data driven decision making helps organizations transform information into practical action. By defining objectives, validating data, analysing options, and measuring results, businesses can make more transparent and informed decisions. Success depends on reliable information, responsible data use, and continuous improvement.