2/20/2026
Data AnalyticsHow to Become a Data Analyst Without a Degree in 2026
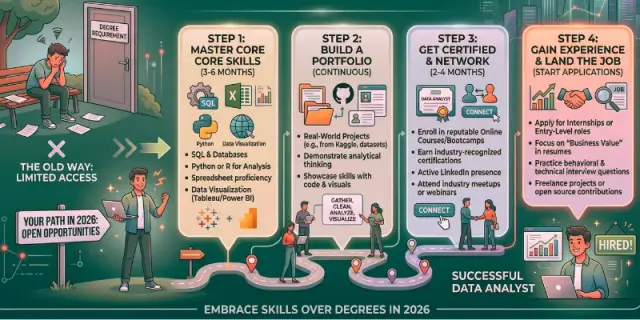
Table of contents
If you do think that you can’t be a data analyst just because you don’t have a technical degree, then let me correct you, it is possible to be one regardless of whether you have a technical degree or not. Today, in the year 2026, breaking into this field is possible, but one needs skills.
So, if you are willing to learn and want to be an expert in this field, then this guide is especially for you. We will guide you thoroughly on what a data analyst actually does, what key skills you have to give priority to, and how to build practical experience through live projects even before your first job.
Why You Don't Need a Degree to Become a Data Analyst
Well, before moving forward, let me tell you that Data Analytics is one of the fields where your skills beat the degree. Even the companies today look more for your skills, like how you can help them grow, solve their problems, and generate meaningful results from raw datasets.
When hiring managers assess junior analyst applicants, they often focus on your ability to manipulate data, create dashboards, write SQL code, and articulate findings — all skills that don't necessarily need a degree.
That shift has opened doors for career changers from retail, teaching, sales, banking, hospitality, and many other backgrounds. Your portfolio and practical ability are your real qualifications.
What Does a Data Analyst Actually Do?
This is very important to understand that what Data Analysts actually do before knowing the tools. So, in simple terms you can understand this like the person who analyse the raw data and try to find the patterns and trends so as to drive a strategy and finding problems to help businesses grow. In big data analytics practice, that means:
- Analyzing trends
- Cleaning messy data
- Building dashboards
- Spotting patterns
- Supporting decisions
- Visualizing findings
Once you understand the actual purpose of the work, learning the technical tools becomes much faster and more focused.
The Core Skills You Need to Learn (In Order)
Here's a simple, beginner-friendly learning roadmap. You don't need to master everything at once — build one skill at a time.
Step
Skill
What You’ll Learn
Step 1
Excel
Formulas, pivot tables, charts, and data cleaning
Step 2
SQL
Pull, filter, and query data from databases
Step 3
Power BI or Tableau
Create dashboards and interactive visuals
Step 4
Python (Optional)
Basic data analysis and automation
Excel: Your First and Most Important Skill
This is where almost every analyst begins. Excel will educate you on the typical characteristics of data: how to clean it, how to summarize it, and how to find issues within it. It is visual, easy for beginners to grasp, and directly relevant in most business contexts. Give more priority to formulas (VLOOKUP, IF, SUMIF), pivot tables, and basic charting; those four skills will carry you a long way.
SQL: The Skill That Makes Employers Pay Attention
SQL is the language that analysts use to interact with and extract information from a company's database. It is that one skill that you can find in every data analytics job description, even for entry-level positions. Learning SQL enables you to extract particular data sets from large databases, filter through enormous quantities of information, join several tables together, and answer actual business questions directly from the database itself. This tells employers that you can work with data at scale, not just in spreadsheets.
Power BI or Tableau: Turning Data Into Decisions
Ok, so moving ahead, now comes the Power BI and Tableau. Till now, you have came across the basic concepts like Excel and SQL, which are all about how to analyze data, you know what that is the half of the job. But after analyzing the data you have to present it too, in a more clearer manner. Here the role of Power BI and Tableau comes.
Here what you will learn:
- Connect to Data Sources
- Clean and Transform Data
- Create Visualizations
- Build Interactive Dashboards.
- Use Calculations & Formulas
- Share Insights
- Learn Best Practices
Employers value this heavily because most decisions are made by people who don't read raw numbers — they read charts and dashboards.
Build Projects: This Is Your New Degree
When you have no academic credentials to show, your project portfolio becomes your qualification. Projects prove you can think analytically, apply tools to real problems, and communicate your findings — exactly what employers want to see.
Good beginner project ideas include:
- Sales performance dashboard
- Customer segmentation analysis
- HR attrition report
- E-commerce revenue trends
- Social media analytics
Start with free datasets from places like Kaggle or Google Dataset Search. Try to work on the project, analyze the data, write up your findings, and share them. Just two or three well-documented projects can often impress more than any degree.
What Roles to Apply for First
Don't wait until you feel "ready." Apply early and often. These entry-level titles are the most accessible for candidates without a degree or formal experience:
Role
What You’ll Do
Average Salary (India)
Junior Data Analyst
Work with datasets, clean data, create basic reports and dashboards
₹3 – ₹6 LPA
Business Analyst
Analyze business processes, gather requirements, and support decision-making
₹4 – ₹8 LPA
MIS Executive
Manage reports, maintain data records, and generate regular business insights
₹2.5 – ₹5 LPA
Reporting Analyst
Build reports, track KPIs, and present data to stakeholders
₹3 – ₹6 LPA
Operations Analyst
Analyze operational data to improve efficiency and workflows
₹3 – ₹7 LPA
Data Technician
Handle data entry, cleaning, and basic database tasks
₹2 – ₹4.5 LPA
These roles typically have fewer requirements, welcome career changers, and give you the real-world experience that accelerates everything else. One year in a junior role will teach you more than another six months of solo studying.
How to Build a Portfolio That Gets You Hired
Your portfolio is basically the spot where all your stuff pulls together, you know. It does not have to be something super fancy or anything. Like, a neat GitHub page, or just a basic personal website, even a sorted Google Drive folder could do the trick. I think the real point is that when a hiring person checks it out, they get right away what kinds of problems you tackled and the way you went about fixing them.
So, put in there your dashboards, maybe with some screenshots to show them off. Then the SQL queries too, but add some notes on what business stuff they were answering, that makes sense. Google Data Analytics Certificate
For every project, throw in a quick description or something. And if you picked up Python along the way, those notebooks you made, include them as well. It feels like keeping the whole thing simple to move around in is key, so the projects can just stand on their own without extra hassle.
Don't Ignore Soft Skills
Technical skills are what make your resume stand out at first, but soft skills are really what land you the job in the end. I think data analysts end up spending a lot of their time just breaking down what the numbers actually mean for folks who do not want all the tech details. Like, explaining it in a way that clicks without going too deep.
Strong communication helps a ton here, along with having a solid way to solve problems and turning data into something like a story. That stuff sets you apart from people who just know how to use the tools but nothing else. It seems kind of obvious once you think about it.
Conclusion
Becoming a data analyst without a degree is possible in 2026 if you focus on practical skills and consistent learning. Start with Excel, SQL, and Power BI, build real-world projects, create a strong portfolio, and improve your communication skills. Your ability to analyze data and solve business problems can open doors to entry-level opportunities. Microsoft Data Analyst training With the right skills, projects, and dedication, you can build a successful career in data analytics.
About the Author
Quick facts
Name: Deepanshu
From: Delhi
Education: MCA
Program: Data Science and Data Analytics
Placed in: NIDADS (National Institute of Data Analytics & Data Science)
Covers topics: Data Science, Data Analytics, Artificial Intelligence, Machine Learning, Data Engineering, Deep Learning
Currently working as: Senior Data Analyst
In his words: "Data doesn't just tell you what happened — it tells you what to build next. My job is to turn numbers into decisions that actually move the needle."